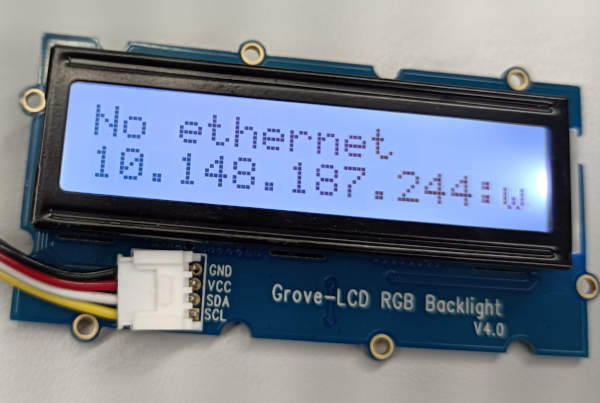
Plug the display into an I2C port on the grovepi
The Grove LCD Display that we use is a 16x2 character LCD screen. It has a backlight which can be set to any RGB colour, which can be useful for an easy to spot output from your algorithms when an event is sensed or something.
When you start up the Pi, the LCD shows the ip address. If you overwrite this and want to reset the display to see the ip address again, then run python showIP.py in the terminal
It also provides a small and poor quality implementation of the graph API from the websensor platforms, to display small line graphs.
We provide a bunch of functions to use this display.

How to show text on the display
To write text onto the display, you can use the grovelcd module:
import grovelcd
grovelcd.setText("Hello world\nSecond Line")
RGB backlight
The RGB backlight just lights up the whole LCD display with a colour. You can set it using the grovelcd module:
import grovelcd
# set backlight to RGB colour
# (each of R,G and B range from 0-255)
grovelcd.setRGB(0,255,128)
Graph module
The graph module displays a simple line graph visualisation of values which are added to it. It supports options for splitting into subgraphs vertically and horizontally. On GrovePi, only 1 or 2 graphs per axis are supported, i.e. you can show up to a total of 4 graphs. On the web-sensor platform these are theoretically unlimited, although more than about 8 gets pretty hard to read.
To draw graphs, you first call graphs.set_style(name,colour,min_val,max_val,subgraph_x=0,subgraph_y=0) to tell the graphs module that you have a graph with a particular name, and set the minimum and maximum values for it. On GrovePi, the colour argument is ignored. Then for each value you want to add, you call graphs.on_value(name,value).
The below example demonstrates how to show two sensor values on a pair of graphs - it should work both in the browser and on a grovepi board.